This project can be found on GitHub here.
- GitHub for:
Continuous-Integration/Continuous-Deployment (CI/CD)- HTTP API Replication
- Important Project Documents
- Microsoft Entra ID with:
- Azure Default Directory application for
Service Principal
- Azure Default Directory application for
- Azure Key Vault for:
Service Principal- Storing other secrets, passwords and credentials
- Azure SQL Database with Azure SQL Server
- Microsoft SQL Server with:
- Microsoft SQL Server Management Studio
- Microsoft SQL Server Configuration Manager
- ANSI SQL
- DBeaver for the
ER Diagram - Microsoft Integration Runtime
- Windows Firewall
- Azure Data Lake Gen2 Storage Account
- Azure Data Factory
- Azure Databricks with
- PySpark
- Delta Tables
- Azure Synapse Analytics with
Serverless Database Pool- Transact-SQL
This is what the project schematics look like:

This project uses GitHub for Continuous-Integration/Continuous-Deployment (CI/CD) throughout its course. For each major development change, a new dev branch was created, and for final testing, a separate qa branch was used with its own environment setup.
For security, Service Principal was used with the combination of Microsoft Entra ID with Azure Default Directory App and Azure Key Vault was used. Azure Key Vault was also used to store other important secrets, passwords and credentials.
Dynamic links, triggers, datasets, data flows and other pipeline activities were used wherever permissible to avoid hard coding. They were tested thoroughly with the required credentials.
The project involves data ingestion from multiple sources:
- HTTP API with JSON softline product data
- Azure SQL Database
- On-Premise Microsoft SQL Server
Note
GitHub HTTP API Replication
To replicate the HTTP API, I created and uploaded the JSON documents to GitHub, which can be found here. I used their direct raw HTTP links to pull data.
The direct links to the JSON files are here:
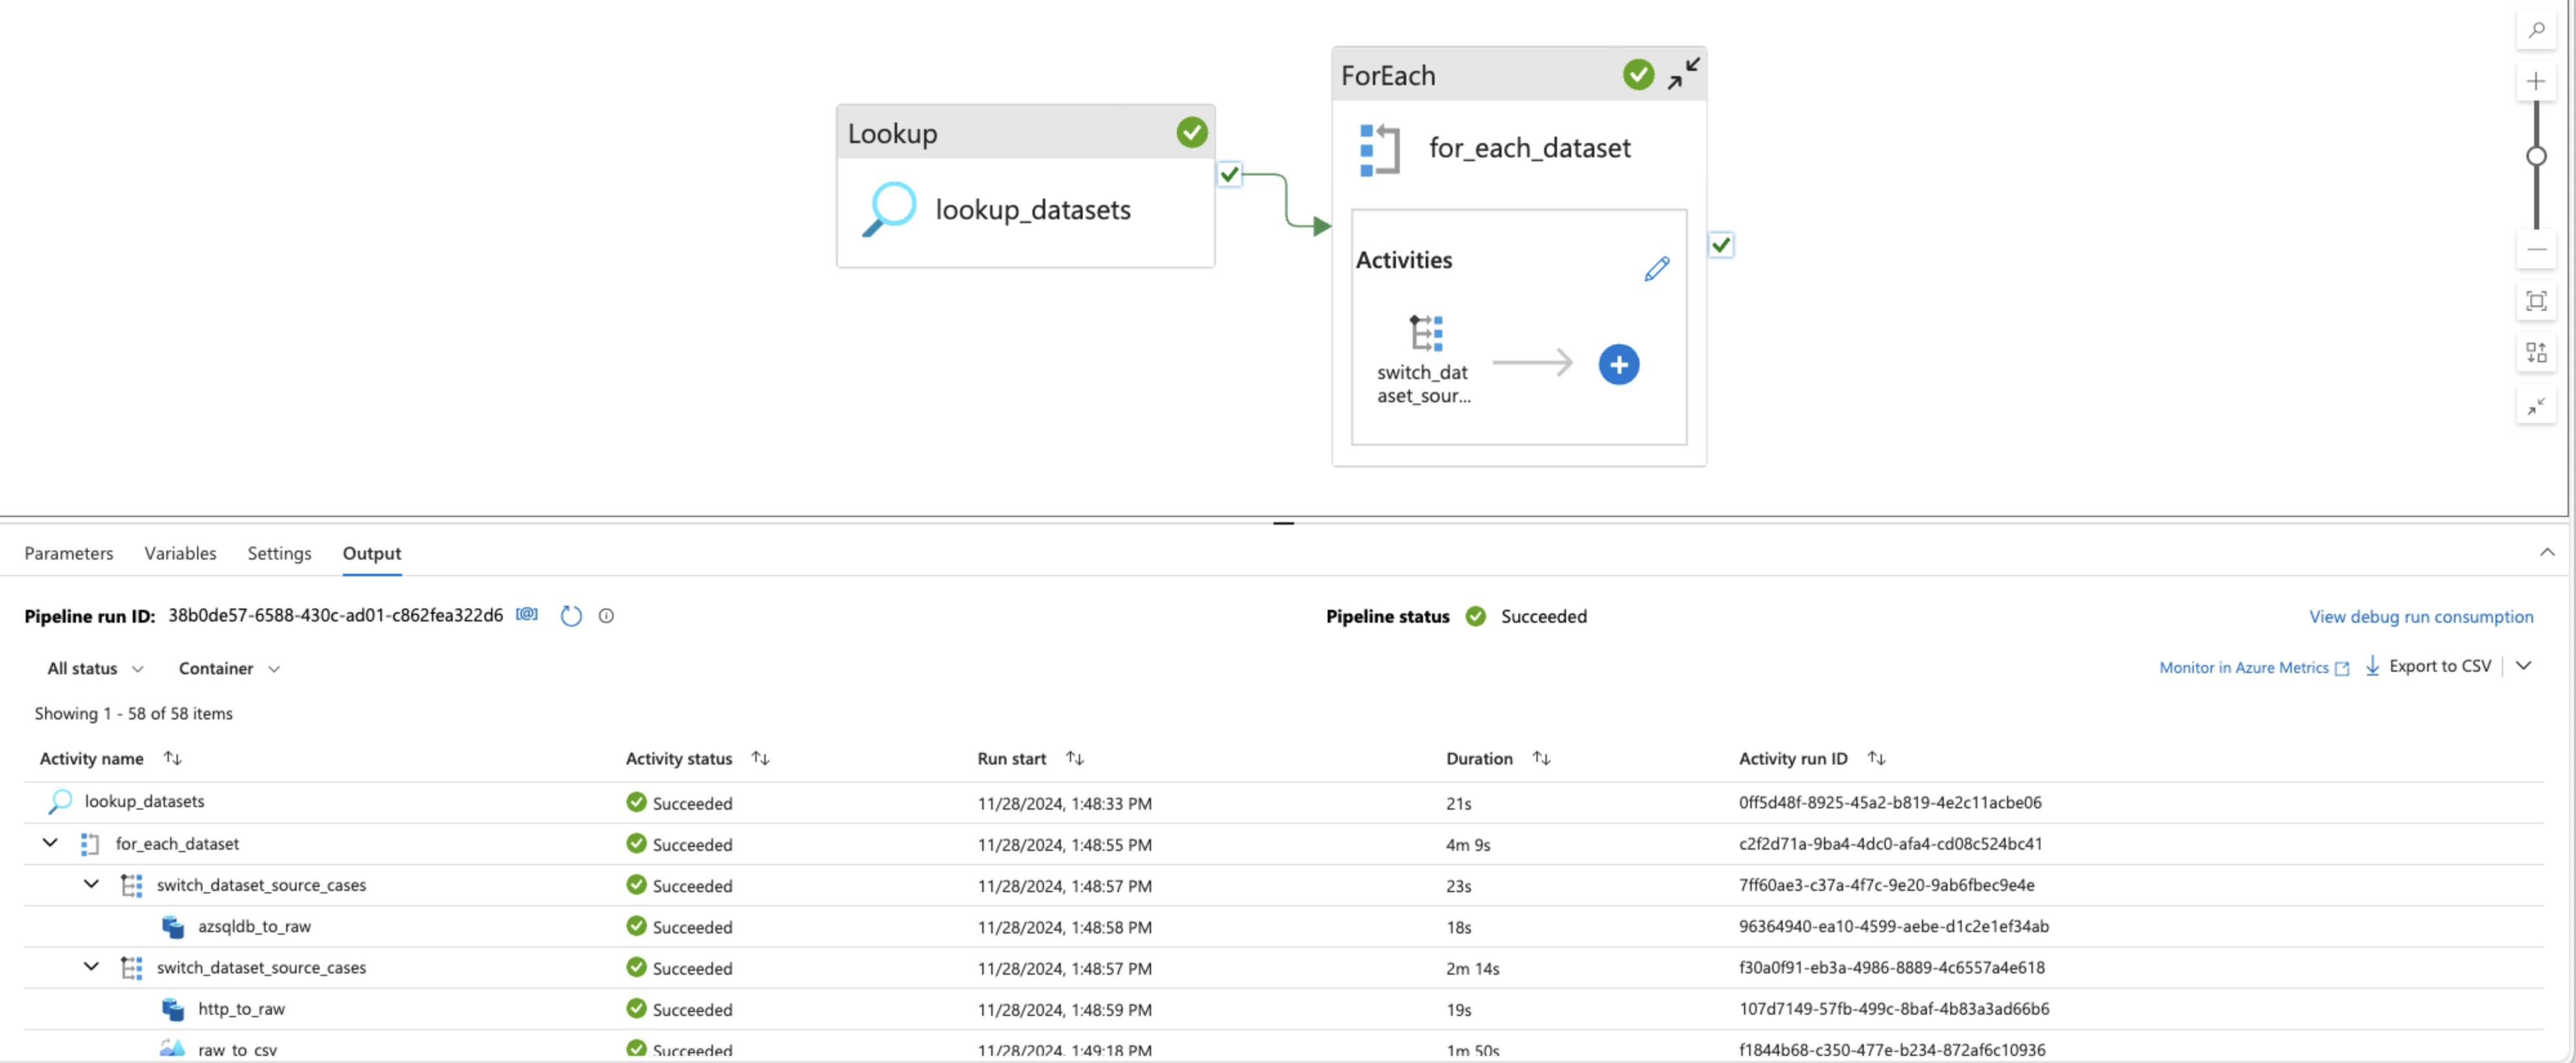
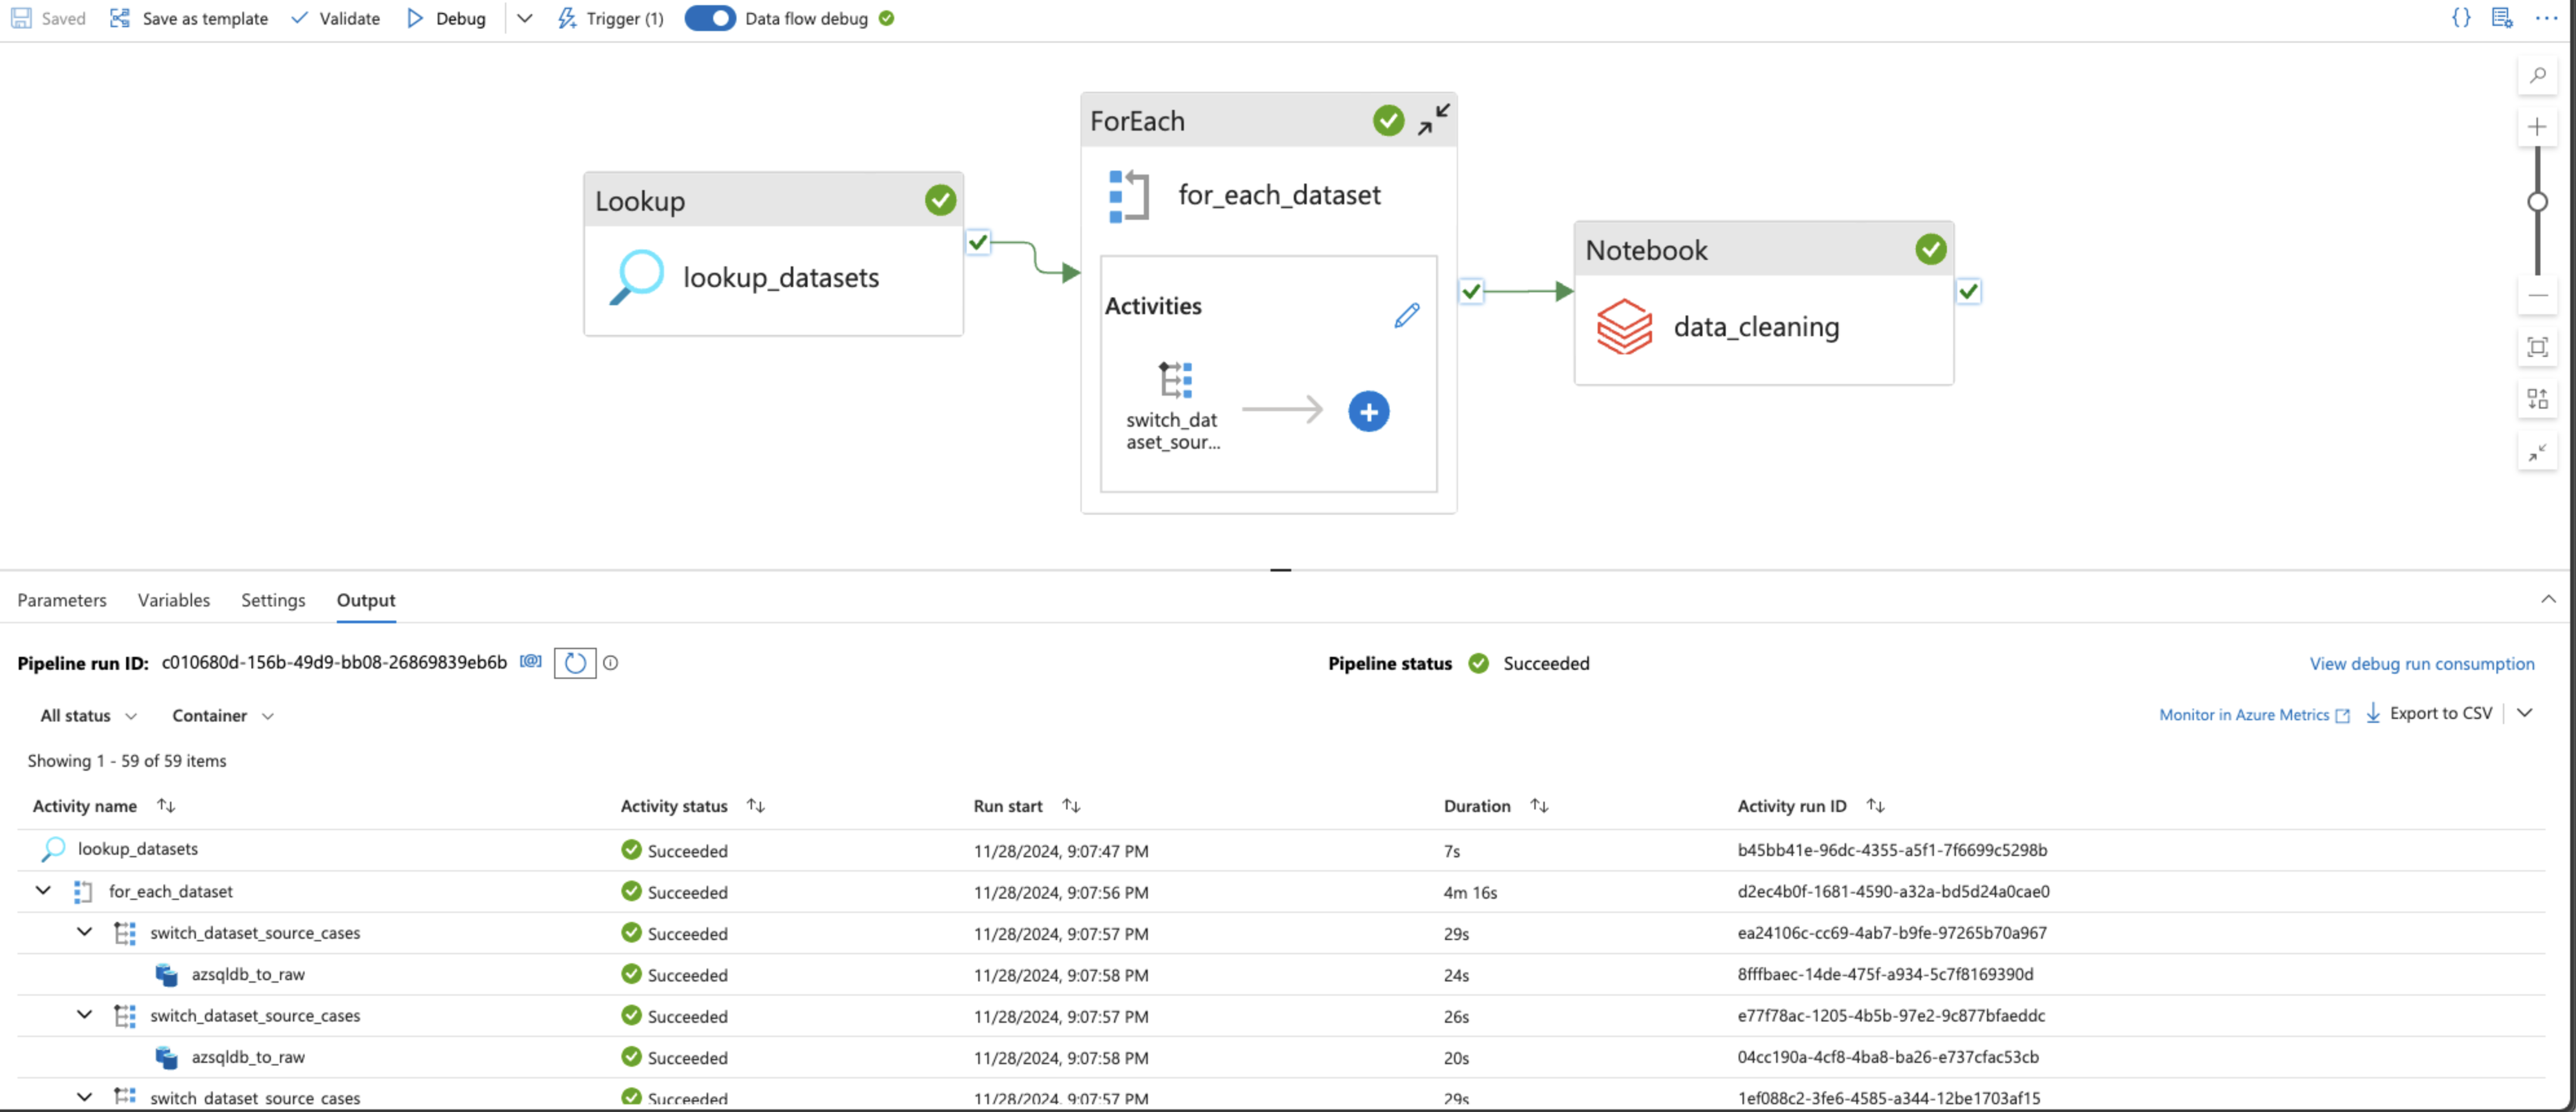
The raw data from the various sources is then stored in the "raw" container of the Azure Data Lake Storage Gen2 Account using Azure Data Factory pipeline.
Lookup, Foreach and Switch activities are used to automate the dynamic pipeline for each dataset and data source.
Note
Lookup JSON Document
A JSON document (lookup.json) was created and uploaded to the "metadata" container of the Storage Account with all the datasets and their respective sources. A sample of this document can be found here.
The JSON raw data are stored first as it is using the Copy data activity, and then as CSV using the Data flow to ensure that the nested objects and arrays are saved properly under their respective CSV headers.
Copy data activity is also used for the raw data ingestion from the Azure SQL Database* and Microsoft SQL Server as parquet formats.
Using PySpark in an Azure Databricks cluster, the raw data is then cleaned and stored in Delta Tables onto the "curated" container of the Storage Account.
With another Databricks cluster, ETL is performed on the Delta Tables (as per the business case scenario). The transformed Delta Tables are stored in the "staging" container.
The two Azure Databricks clusters are incorporated into the Azure Data Factory pipeline, and the parameterized pipeline is again automated using a trigger that runs at the end of each day (at 08:00 pm) with the respective values for each parameter.
Azure Synapse Analytics with a Serverless Database Pool is used to create external tables from the Delta Tables in the curated and staging containers of the Storage Account.
Using Transac-SQL (T-SQL) in the Azure Synapse Analytics, a thorough analysis was performed on the available data from the various sources.
On Microsoft SQL Server, a new sample database was created using Microsoft SQL Server Management Studio with SQL Server Authentication credentials.
The DDL could be found here.
Here's what the sample code from the DDL looks like:
CREATE TABLE Customer (
	CustomerID INT IDENTITY(1,1) PRIMARY KEY,
	FirstName NVARCHAR(50),
	LastName NVARCHAR(50),
	Email NVARCHAR(100),
	Phone NVARCHAR(15),
	AddressLine1 NVARCHAR(200),
	AddressLine2 NVARCHAR(200),
	City NVARCHAR(100),
	StateID INT FOREIGN KEY REFERENCES StateProvinceRolling(StateID),
	PostalCode NVARCHAR(20)
);

INSERT INTO Customer (FirstName, LastName, Email, Phone, AddressLine1, AddressLine2, City, StateID, PostalCode)
VALUES
	('John', 'Doe', 'john.doe@example.com', '1234567890', '123 Main St', '', 'Toronto', 1, 'M5H 2N2'),
	('Jane', 'Smith', 'jane.smith@example.com', '9876543210', '456 Elm St', '', 'Los Angeles', 4, '90001');

SELECT * FROM Customer;Here's the detailed ER Diagram:
erDiagram
	CountryRolling {
		INT CountryID PK
		NVARCHAR CountryName
	}

	StateProvinceRolling {
		INT StateID PK
		NVARCHAR StateName
		INT CountryID FK
	}

	Customer {
		INT CustomerID PK
		NVARCHAR FirstName
		NVARCHAR LastName
		NVARCHAR Email
		NVARCHAR Phone
		NVARCHAR AddressLine1
		NVARCHAR AddressLine2
		NVARCHAR City
		INT StateID FK
		NVARCHAR PostalCode
	}

	Seller {
		INT SellerID PK
		NVARCHAR SellerName
		NVARCHAR Email
		NVARCHAR Phone
		NVARCHAR AddressLine1
		NVARCHAR AddressLine2
		NVARCHAR City
		INT StateID FK
		NVARCHAR PostalCode
	}

	ProductCategories {
		INT CategoryID PK
		NVARCHAR CategoryName
	}

		Product {
		INT ProductID PK
		NVARCHAR ProductName
		NVARCHAR Brand
		NVARCHAR Specifications
		INT CategoryID FK
	}

	CustomerProductReview {
		INT ReviewID PK
		INT ProductID FK
		INT CustomerID FK
		INT Rating
		NVARCHAR Review
	}

	CustomerSellerReview {
		INT ReviewID PK
		INT SellerID FK
		INT CustomerID FK
		INT Rating
		NVARCHAR Review
	}

	ProductQuality {
		INT ProductQualityID PK
		NVARCHAR QualityType
	}

	Promotion {
		INT PromotionID PK
		NVARCHAR PromotionDescription
		DECIMAL DiscountPercentage
	}

	SellerProductPromotion {
		INT PromotionProductID PK
		INT SellerID FK
		INT ProductID FK
		INT ProductQualityID FK
		DECIMAL Price
		INT PromotionID FK
	}

	Order {
		INT OrderID PK
		INT CustomerID FK
		INT PromotionProductID FK
		INT Quantity
	}

	StateProvinceRolling }o--|| CountryRolling: "Resides in"
	Customer }o--o| StateProvinceRolling: "Lives in"
	Seller }o--o| StateProvinceRolling: "Located in"
	Product }o--|| ProductCategories: "Has"
	Customer ||--o{ CustomerProductReview: "Writes"
	CustomerProductReview }o--|| Product: "Reviews"
	Customer ||--o{ CustomerSellerReview: "Writes"
	CustomerSellerReview }o--|| Seller: "Reviews"
	Seller ||--o{ SellerProductPromotion: "Creates"
	SellerProductPromotion }o--|| Product: "Has"
	SellerProductPromotion }o--o| ProductQuality: "Is of Quality"
	SellerProductPromotion }o--o| Promotion: "Includes"
	Customer ||--o{ Order: "Places"
	Order }o--|| SellerProductPromotion: "Contains"
Here's the output ER Diagram as visualized in DBeaver:

To replicate an HTTP API with softline product datasets, GitHub was used.
Some sample JSON datasets were created and uploaded to the GitHub Repository, which were later accessed through their raw links. The information about the data has been provided above.
Created an Azure Default Directory* application using Microsoft Entra ID, and then created a client secret.
Used Azure Key Vault in an Azure Resource Group to store the following credentials:
Client ID, also known asApplication IDandService Principal IDDirectory ID, also known asTenant IDClient Secret- Self-hosted on-premise
Microsoft SQL Server Authentication Password
Created an Azure Data Lake Gen2 Storage Account with the following Blob Storage Containers:
- metadata
- raw
- curated
- staging
Under IAM Access Control, appropriate roles were assigned to the Azure Default Directory application to give other resources (such as Azure Data Factory, Azure Databricks and Azure Synapse Analytics) required access through the Service Principal.
An Azure SQL Database with SQL Server and a sample dataset was created. The password credentials were stored in the Azure Key Vault.
Since the Azure Data Factory pipelines would be parameterized for reusability and modular purposes, a lookup JSON document was created to include all the datasets with their sources. The file was uploaded to the metadata container. The link to the sample file has been provided above.
This is what a part of the JSON document looks like:
{
	"source": "onprem_sqlserver",
	"filename": "Seller"
},An Azure Data Factory resource was created in the Resource Group, and linked to the GitHub Repository. The principles of Continuous Integration/Continuous Development (CI/CD) were followed throughout the development and testing process. For each stage of the development, testing and deployment, GitHub Repository branches were created and used. Each stage was tested thoroughly under separate environments and conditions.
The Azure Data Factory was given access to the Azure Key Vault credentials through Key Vault Access Policies. At the same time, the access was created for AzureDatabricks for later use.
All the linked services, integration runtime environment, datasets, data flow and pipelines were parameterized and created dynamically.
Linked services for the following resources were created:
- Azure Key Vault
- Azure Data Lake Gen2 Storage Account
- HTTP API — JSON (GitHub)
- Azure SQL Database
- Microsoft SQL Server (
SelfhostedIntegration Runtime Environment)
While creating the Selfhosted Microsoft SQL Server linked service, an integration runtime was also created and linked to an on-premise Microsoft Integration Runtime.
A linked service for Databricks was created later on.
A trigger was created (but not started, since no pipeline attached yet) to run at the end of each day at 08:00 pm.
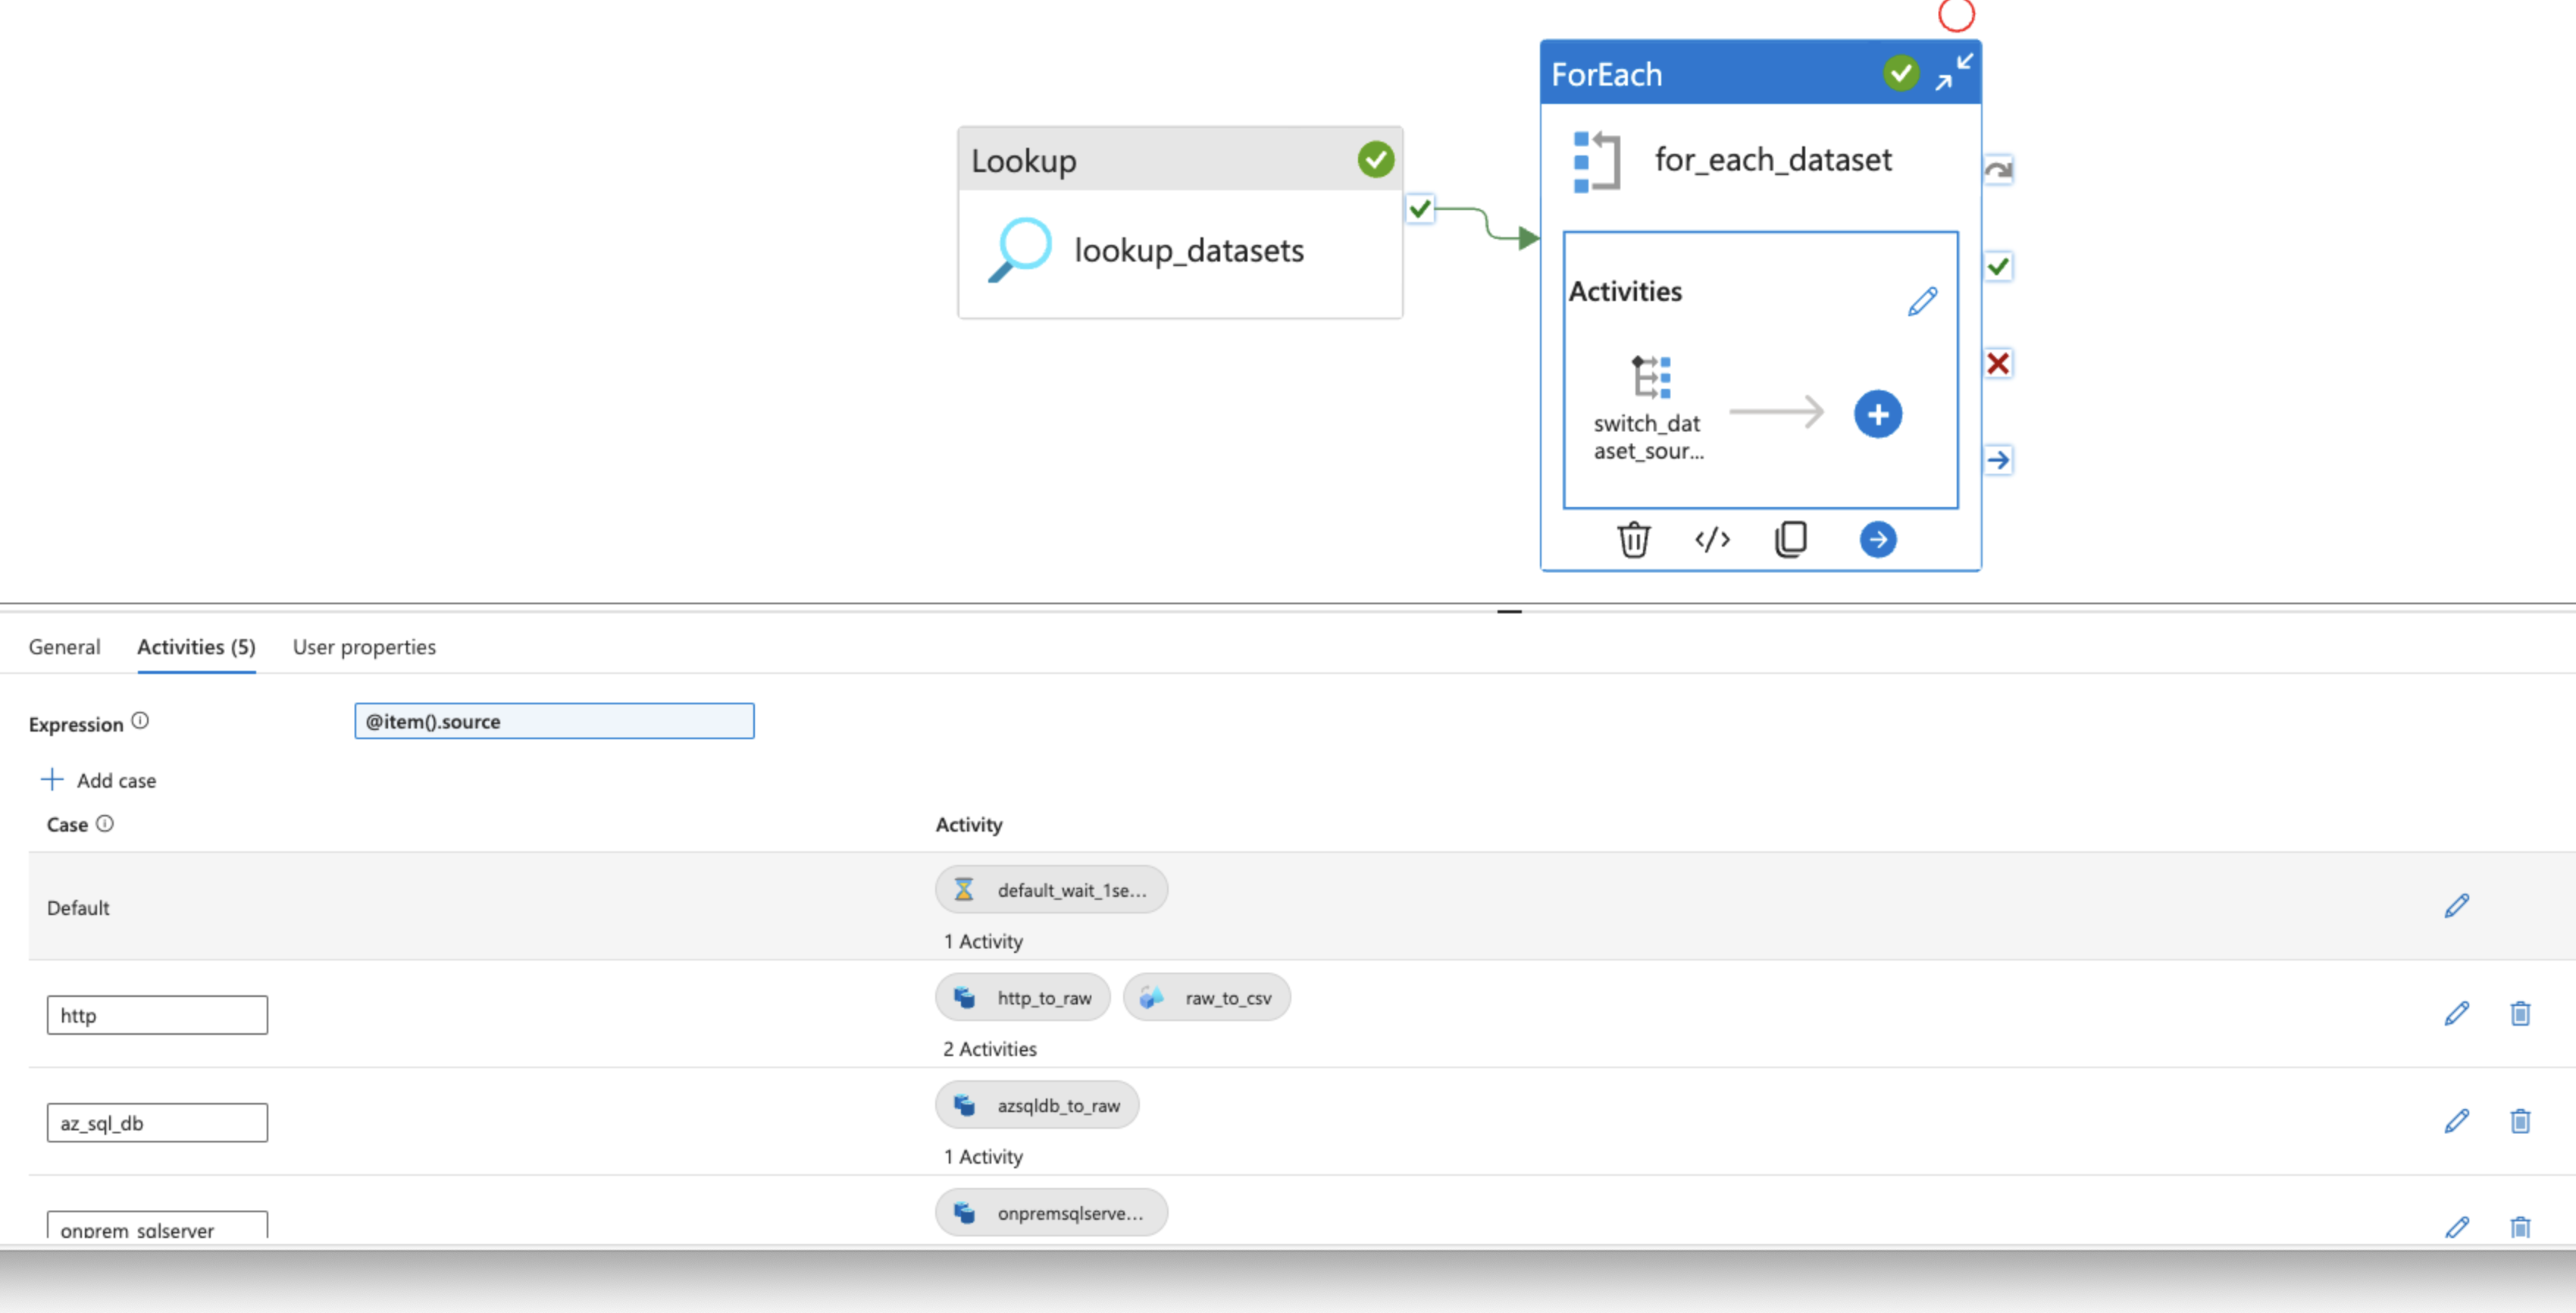
To handle data from multiple sources, a Lookup activity was used with a loopup.json file on the metadata container of the Storage account, as mentioned.
To go through the array output, Foreach activity was used with a Switch activity. Foreach data source, the switch statement would run certain activities.
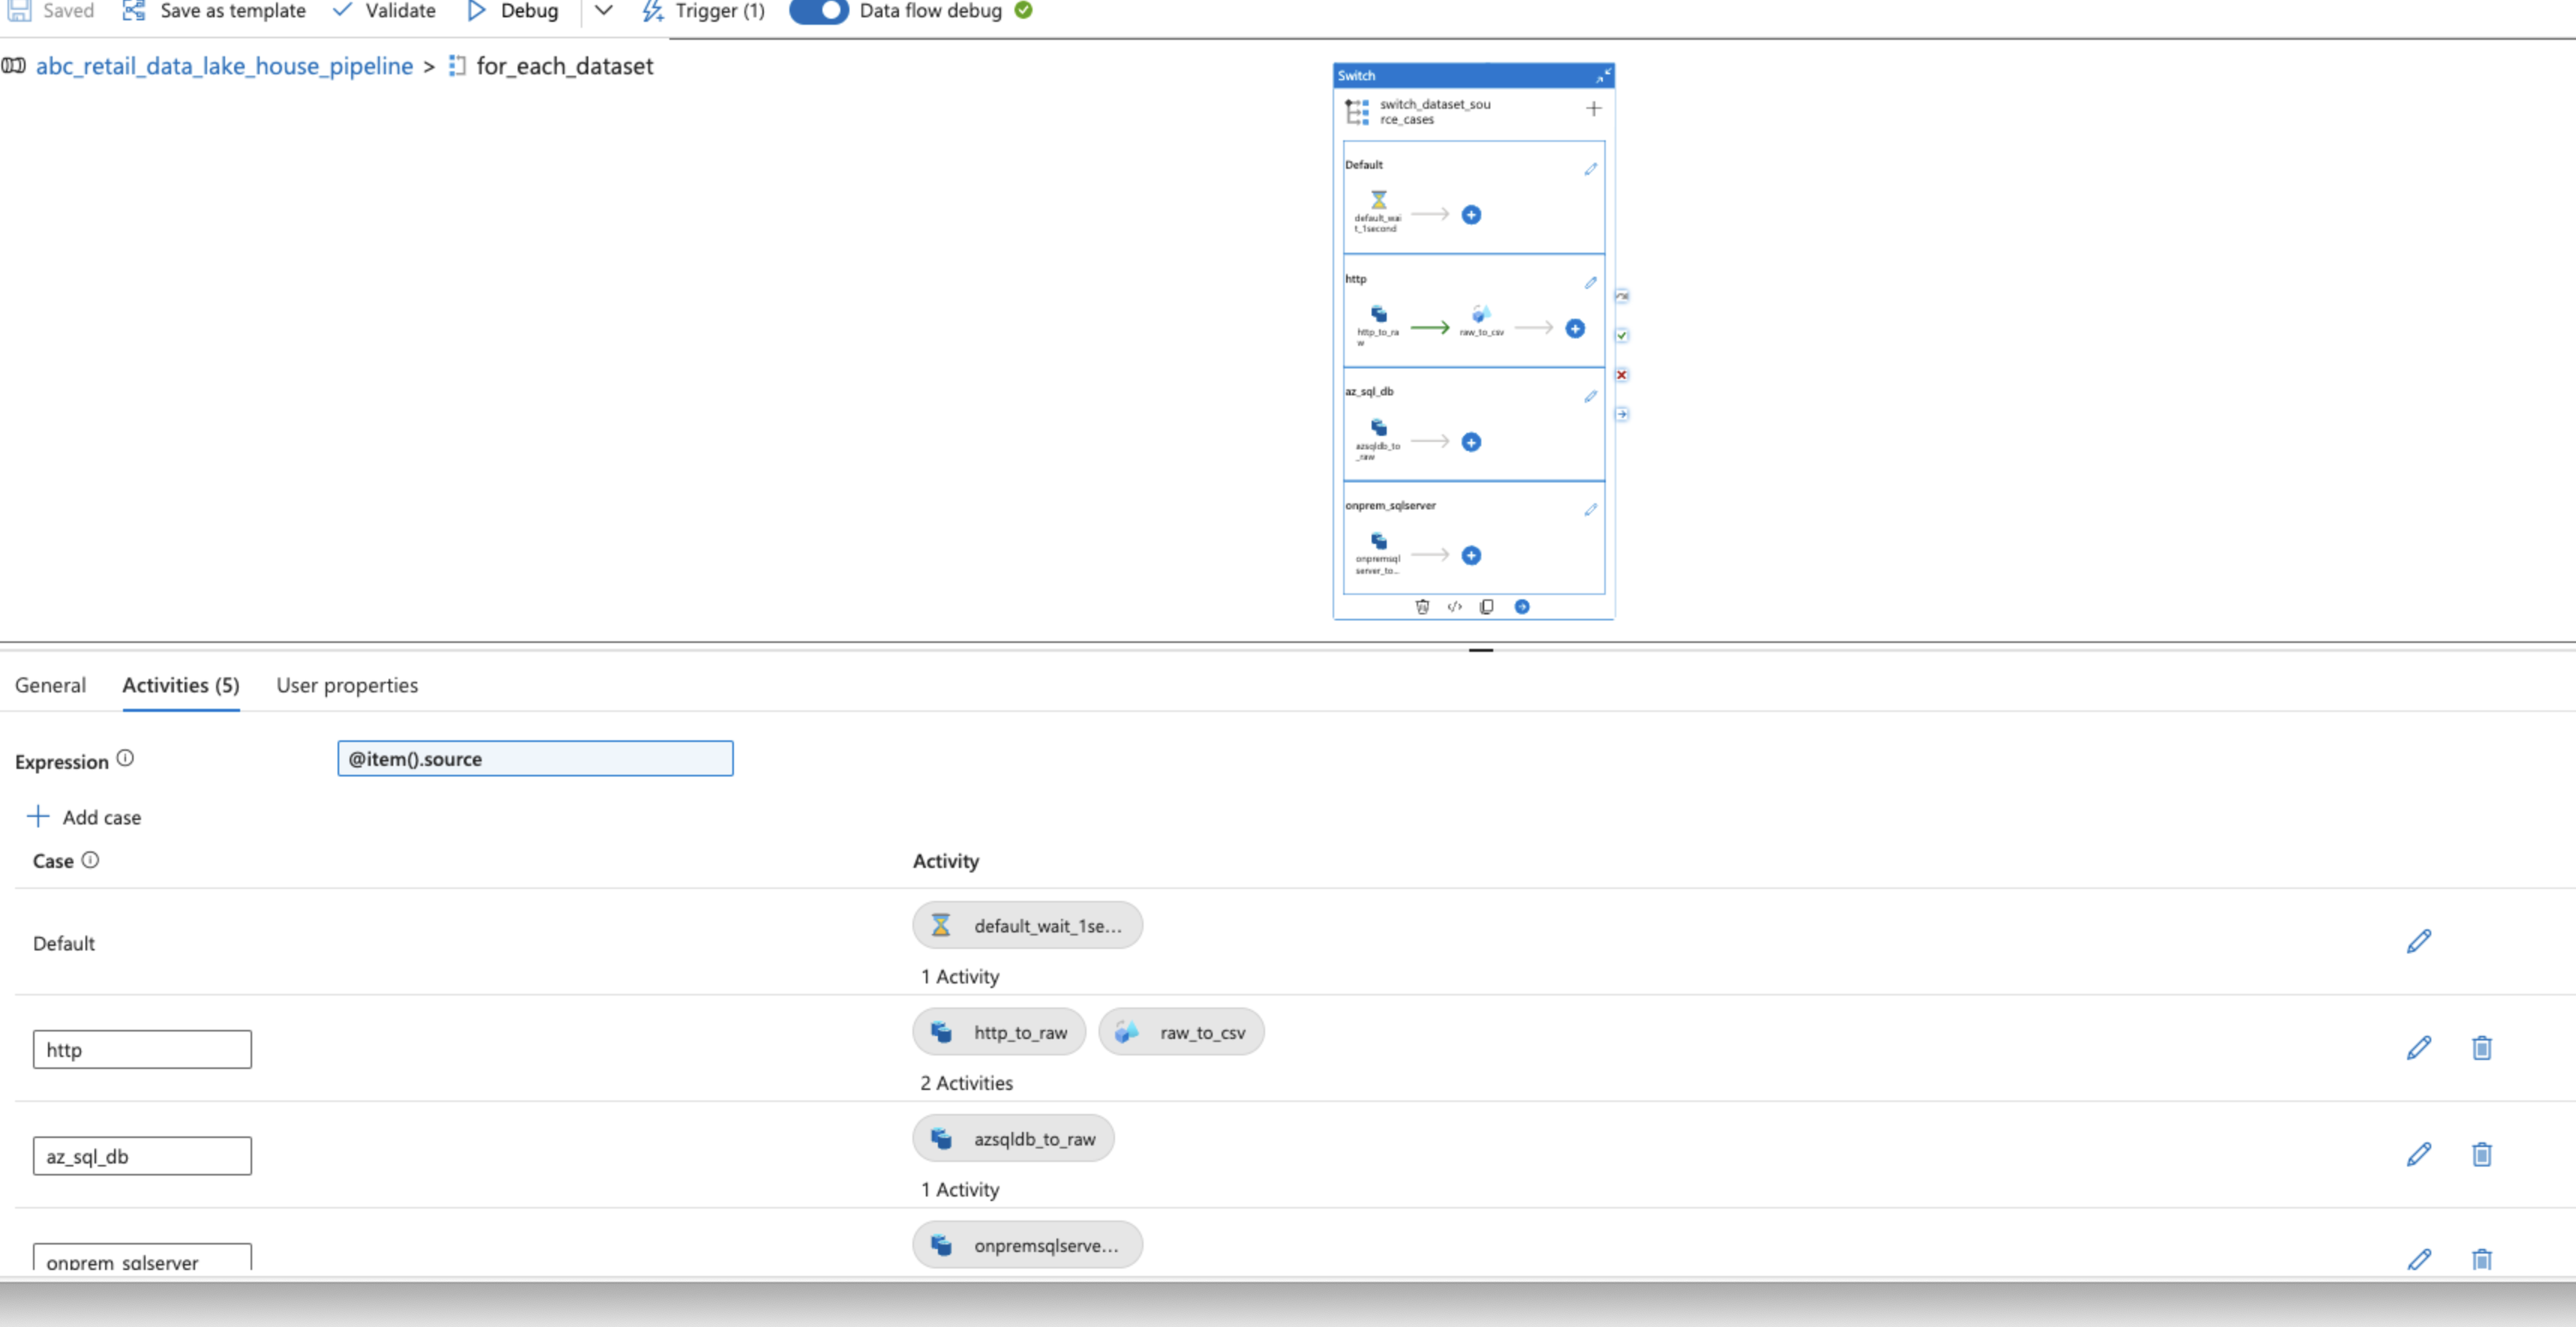
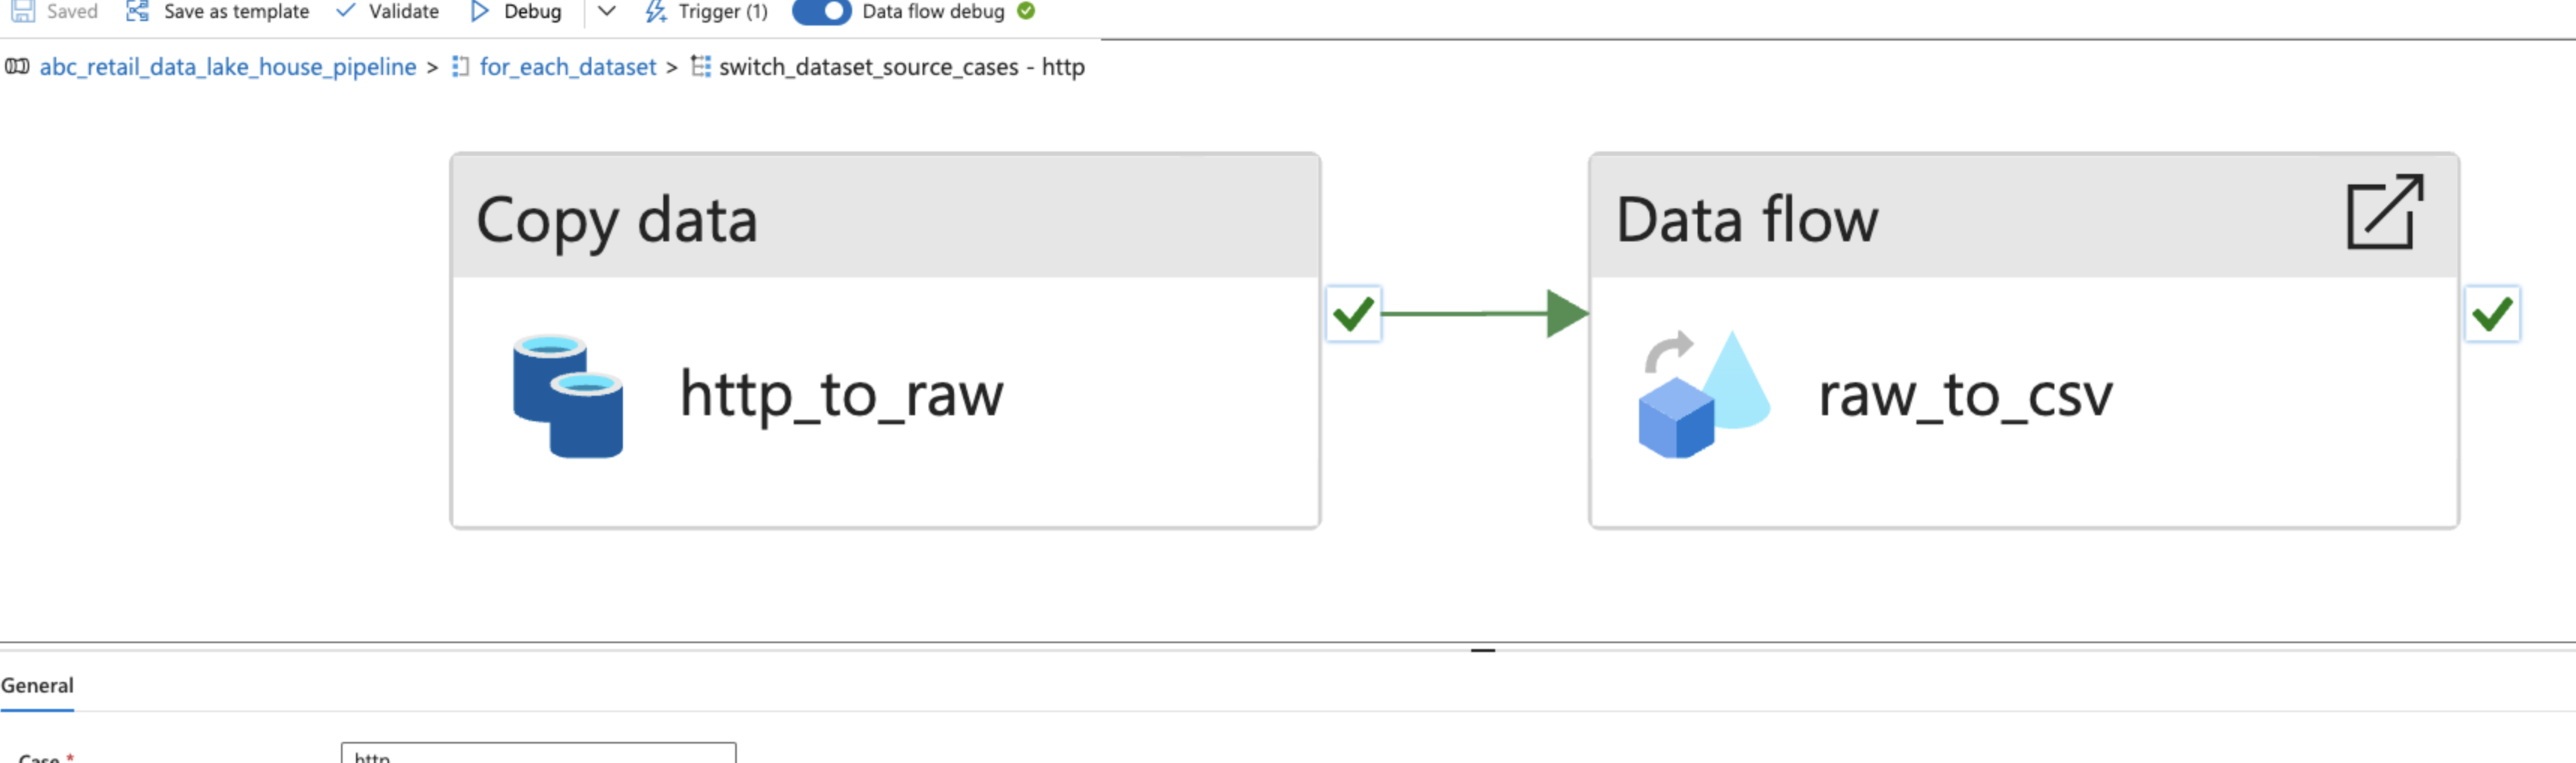
For the JSON data from the HTTP API, two sequenced parameterized activities were used:
- A
Copy dataactivity to simply copy the JSON data as it is. - A
Data flowto ensure that the nested objects and arrays were saved properly under theirCSVheaders.
For the hardline datasets from both the Azure SQL Database and on-premise, self-hosted Microsoft SQL Server, Copy data activities were used to ingest data in the parquet format.
The default activity was left to Wait for 1 second.
An Azure Databricks resource was created in the Resource Group. An access token was created in the settings, and a linked service in the Azure Data Factory for later use.
A secret scope was created to access the credentials from the Azure Key Vault*.
A notebook was created to clean the raw data from various sources. The notebook could be accessed here.
The cleaned data was stored in Delta Tables on the "curated" Blob Storage Container of the Data Lake Storage.
A Databricks Notebook activity was used to automate the process of data cleaning at the end of each pipeline run.
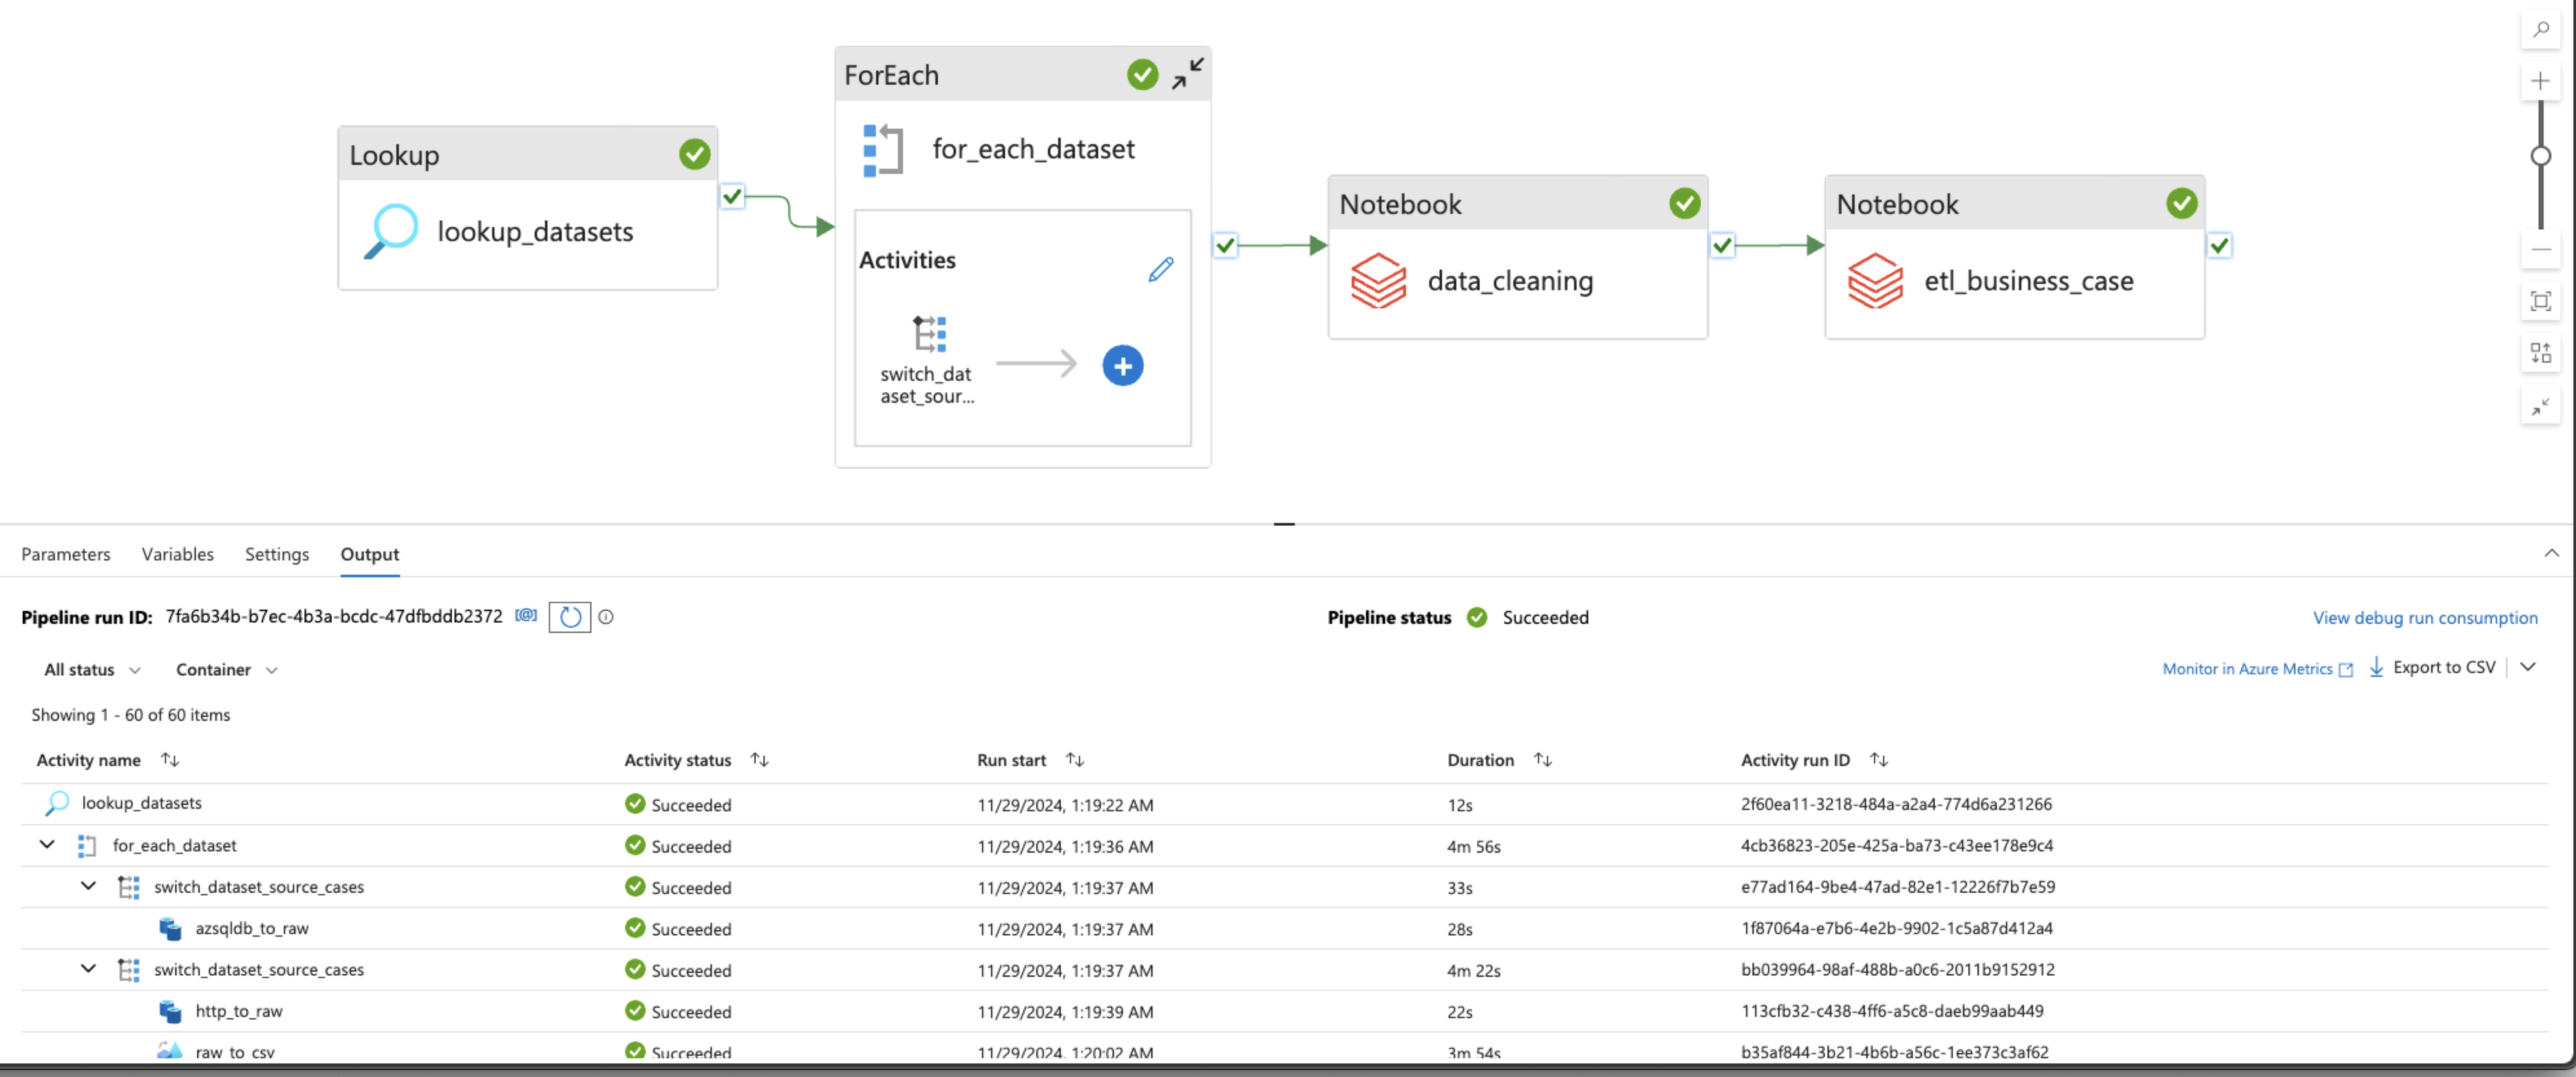
Another Databricks Notebook was created for the business case ETL (Extract, Transform and Load). The data was extracted from the Delta Tables on the "curated" container of the Storage Account, transformed as per the business use cases, and loaded in the Delta Tables onto the "staging" container. The notebook could be found here.
The ETL Azure Databricks notebook was also added to the Azure Data Factory pipeline.
An Azure Synapse Analytics resource was created in the Azure Resource Group, and access to the Key Vault was granted through the Key Vault Access Policies for the Service Principal credentials.
Parameterized dynamic linked services for the Key Vault and Data Lake Storage Account were created.
A serverless database pool was created.
Used T-SQL to create external tables for al the datasets from various sources available on the "curated" and "staging" Delta Tables. The DDL could be found here.
Then performed thorough analysis on the available data using aggregated functions and joins. Then performed some advanced analysis.
Here's a sample of some of the advanced analyses performed:
-- Top 5 Products by Total Sales Revenue

SELECT TOP 5 p.Name AS ProductName,
	SUM(sod.LineTotal) AS TotalRevenue,
	COUNT(DISTINCT soh.SalesOrderID) AS NumberOfSales
FROM [azsqldb_Product] p
JOIN [azsqldb_SalesOrderDetail] sod ON p.ProductID = sod.ProductID
JOIN [azsqldb_SalesOrderHeader] soh ON sod.SalesOrderID = soh.SalesOrderID
WHERE soh.Status = 5  -- 5 indicates completed orders
GROUP BY p.Name
ORDER BY TotalRevenue DESC;
-- Year-Over-Year Sales Growth
WITH SalesByYear AS (
SELECT YEAR(OrderDate) AS SalesYear,
SUM(TotalDue) AS TotalSales
FROM [azsqldb_SalesOrderHeader]
WHERE OrderDate IS NOT NULL
GROUP BY YEAR(OrderDate)
)
SELECT SalesYear,
TotalSales,
LAG(TotalSales, 1) OVER (ORDER BY SalesYear) AS LastYearSales,
((TotalSales - LAG(TotalSales, 1) OVER (ORDER BY SalesYear)) / LAG(TotalSales, 1) OVER (ORDER BY SalesYear)) * 100 AS SalesGrowthPercentage
FROM SalesByYear
ORDER BY SalesYear;Monitor logsfor the Data Factory pipeline runs were checked thoroughly for detailed activity logs and error messages.- Used ADF
Debugmode to test individual activities, and checked for runtime errors. - Ensured that the TCP/UDP ports for the Microsoft SQL Server were properly configured in the Firewall.
- The on-premise server was ensured to be available most of the time so that the data is available and accessible when needed.
- Pipeline parameters and credentials were ensured to be entered correctly.
- Data formats in the
Copy dataandData flowactivities were ensured to match properly. - Ensure no mismatch between the source and sink schema for consistent mapping.
- Ensured that the
Integration RuntimeandService Principalcredentials were configured correctly. - Conditional statements and error handling were used in the Databricks
Notebooksto handle day-to-day activities. - Adjusted the Databricks cluster size to handle larger workloads.
- Analyzed Databricks job and cluster logs for detailed error information. Used Databricks monitoring tools for real-time insights.